MAGIC
Skip navigation and go to main content
- Home
- General Information
- Science with MAGIC
- MAGIC members
- Maintenance

MAGIC performance
All aspects of the MAGIC performance (including tabularized energy-wise performance numbers) are described in detail in Aleksić et al., Astroparticle Physics Volume 72, 1 January 2016, Pages 76–94. The performance shown here corresponds to data taken in 2013.
Integral sensitivity
We define the sensitivity as the integrated flux of a source above a given energy for which the number of excess events (N_excess) divided by the square root of the number of background events (N_bkg) is equal to 5 after 50 hours of effective observation time. In addition, we require that N_excess > 10 and N_excess > 0.05 N_bkg. The corresponding energy threshold is computed as the peak of the true energy distribution of a Monte Carlo sample with a Crab-like spectrum. Integral sensitivity computed according to different definitions and tabularized numbers are available in Aleksić et al. (2016). All the curves are computed using samples of Crab Nebula data. For example, the sensitivity computed according to Li&Ma significance with 5 background regions is (0.67+/-0.04)% C.U. above 290 GeV and (1.45+/-0.02)% C.U. above 100 GeV for 50 hours of observations.
Evolution of the integral sensitivity of the MAGIC telescopes. Gray circles: sensitivity of the MAGIC-I single telescope with the Siegen (light gray, long dashed) and MUX readouts (dark gray, short dashed). Black triangles: stereo before the upgrade. Squares: stereo after the upgrade: zenith angle below 30deg (red, filled), 30−45deg (blue, empty). Figure reproduced from Aleksić et al (2016). The added pink point shows the integral sensitivity above 55 GeV obtained with the PKS1441+25 detection sample.
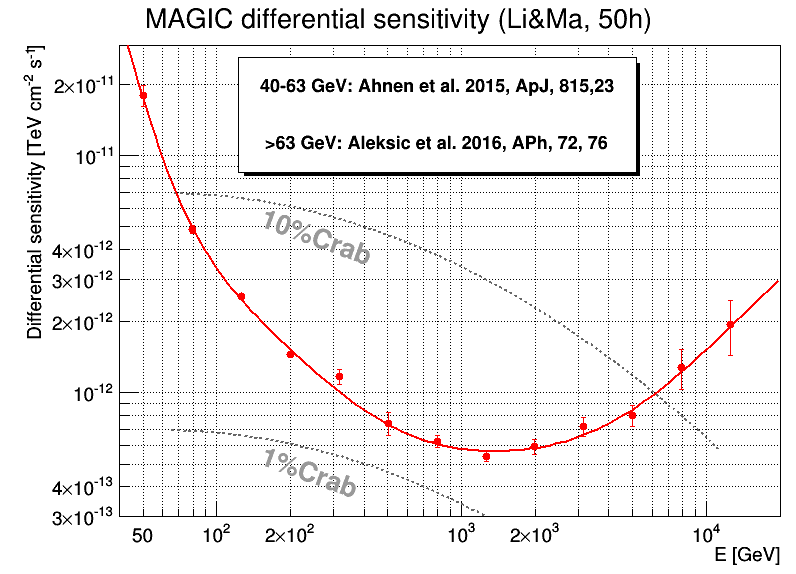
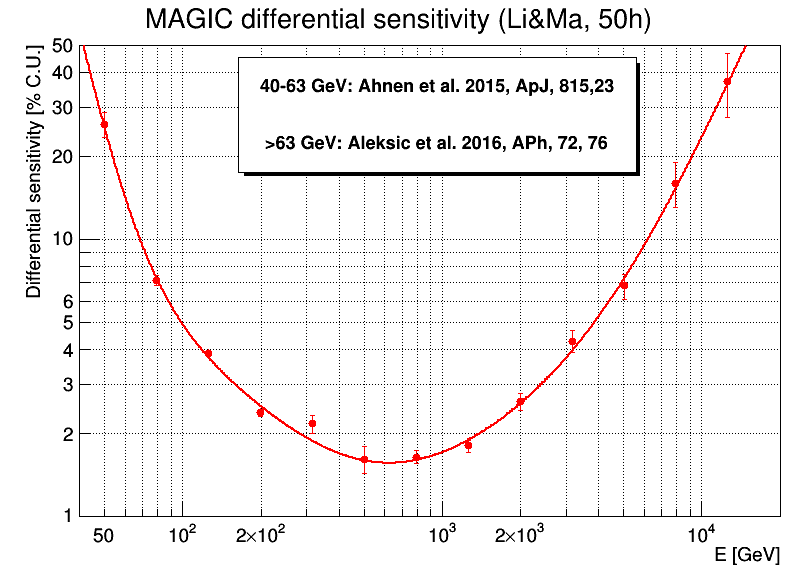
Differential sensitivity
Differential sensitivity of MAGIC, flux of a source which gives after 50h of observations 5 sigma signal (calculated according to Li&Ma formula assuming 3 background regions) in estimated energy bin E1-E2. Low zenith (< 30 degrees) observations. Conversion to absolute flux units is done with Crab Nebula spectrum from [Aleksic et al. 2016, APh, 72, 76]. Points above 63 GeV are obtained with Crab Nebula data (Aleksic et al. 2016, APh, 72, 76), the 40-63 GeV point is obtained with PKS1441+25 data (Ahnen et al. 2015, ApJ, 815, 23).
Sensitivity at ~50 GeV
Even while 50 GeV is usually below the analysis threshold of the MAGIC telescopes (for a standard stereo trigger) for a Crab-like spectrum, it is still possible to perform scientific observations with the MAGIC telescopes at those energies. Due to unfolding corrections for the energy resolution and bias it is also possible to reconstruct reliable spectra at energies not so much below the energy threshold.
Moreover, for steep spectra sources (far AGNs, GRBs, pulsars) the peak energy shifts to lower values. For example, a strong 25 sigma detection of the z=0.939 flat-spectrum radio quasar PKS 1441+25 corresponds to 5% Crab flux sensitivity above 55 GeV for 50 hours of observations.
Angular resolution
We define the angular resolution as the sigma parameter of a 2-dimensional Gaussian function, fitted to the gamma-ray excess distributions. This corresponds to about a 39% containment radius of gamma rays.

Angular resolution of the MAGIC telescopes for data (points) and MC simulations (lines). Red points: low zenith angle sample, blue points: medium zenith angle sample. For comparison, the pre-upgrade low zenith angle angular resolution is shown as gray points. Figure reproduced from Aleksić et al (2016).