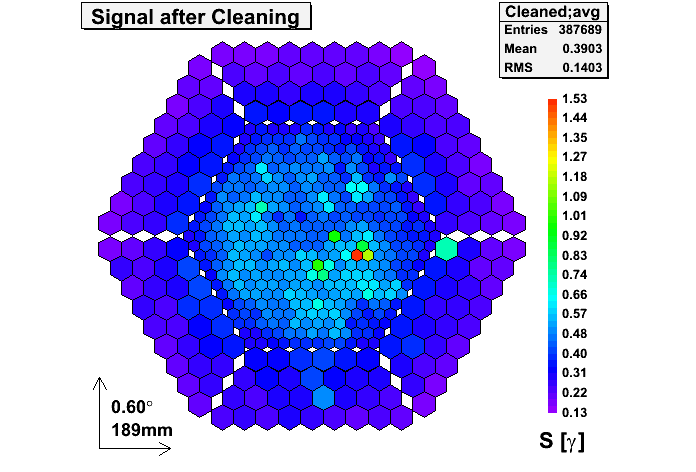
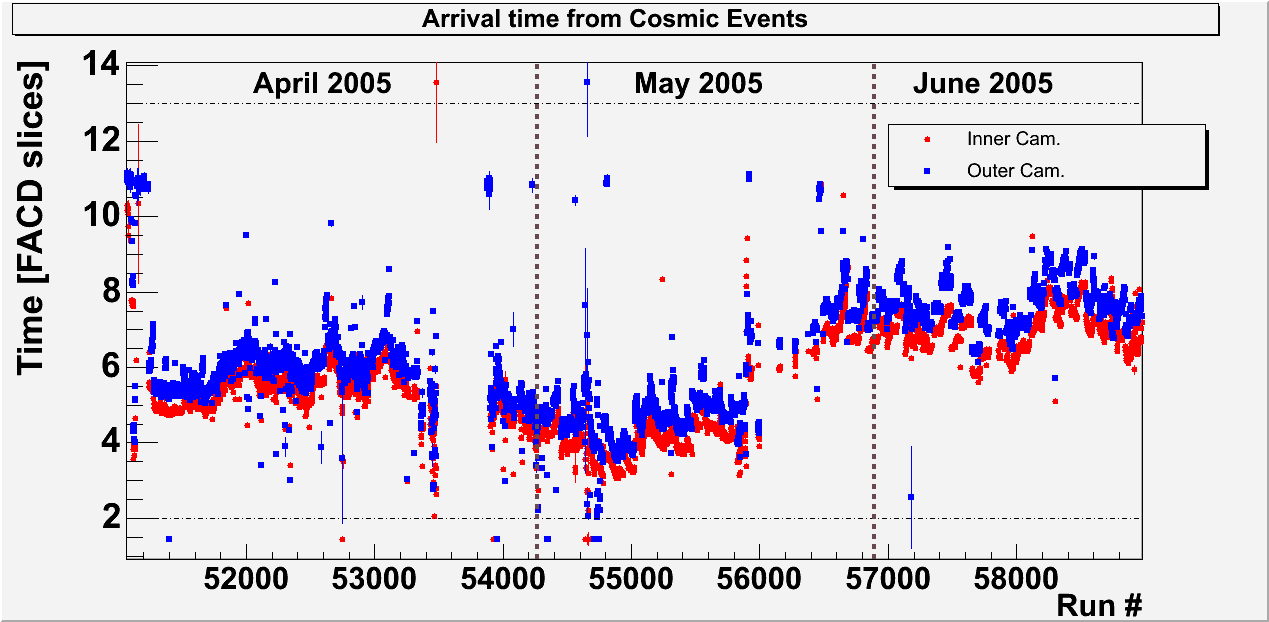
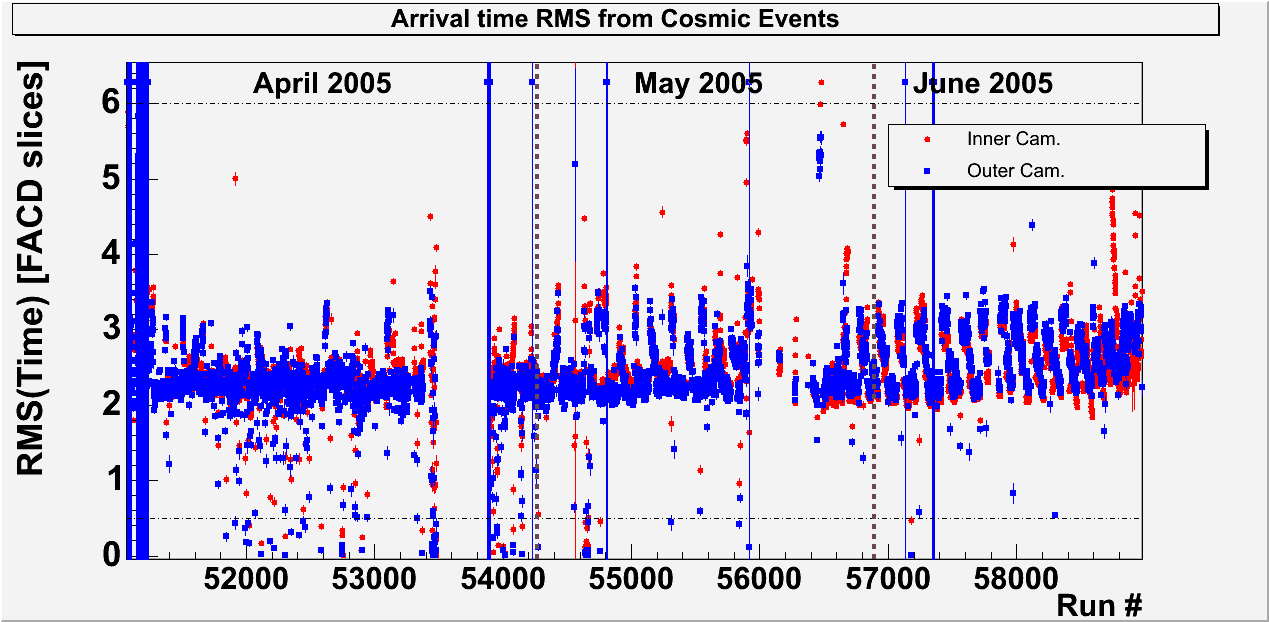
It was checked whether other signal
extractors reduce/do not show/enhance the timing-camera nonuniformity
correlation. The other signal extractors used were the
"Sliding Window" with a 6(8) slice integration window for the high (low)
gain and the Spline integrating over 1 (1.5) slices in the high (low)
gain. The extraction window edges of the pulse position check option
were set to the same values as for the Digital Filter
(-2.5/+4.5+integration size from the mean) . The result can be
summarized as follows:
- Although other signal extractors show relatively large
differences in the arrival time and signal reconstruction, the overall
features do not change, i.e, also there a correlation of the camera
nonuniformity to the window position and size can be observed.
- As an example, the camera plots of the event and charge
distribution are shown here for the night of 2005/06/01 using the
spline extractor. Compared with the Digital Filter, the
inhomogeneities seem to be a little less pronounced.
- The same example was used for a comparison of Sliding Window
and Digital Filter. With the position check on, the Sliding Window gives a
much smoother picture than the Digital
Filter. The improvement by switching the pulse position check off
is much smaller, though.
- For the night of 2005/05/07, where the arrival times are very
early, the Sliding Window produces a slightly smoother camera
distribution than the two other extractors. Here you can find a
comparison of the Sliding Window with the Spline extractor , without
the pulse position check applied.
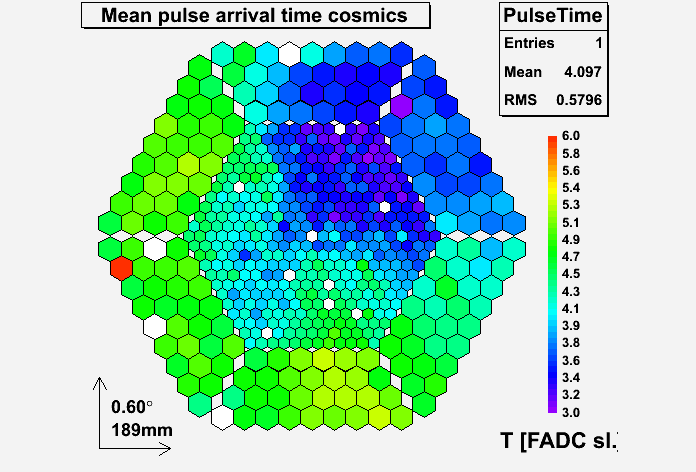
- Another issue is the determination of the arrival time itself.
Below, the average arrival time distributions are shown for 2005/06/01
using the Spline
and the Sliding
Window extractors.
- The comparison of these plots with each other and with the
corresponding plot for the Digital Filter
shows that the finger like structure of the arrival time distribution
might be an effect of the extractor. The fingers of the Spline are
shifted with respect to the Digital Filter, and "smeared out" or not
there for the Sliding Window.
- The finger structure on the other hand seems to be correlated
with the extracted charge distribution. This can be seen from the plot
showing the average
reconstructed charge in N(pe) per inner pixel as a
function of the reconstructed arrival time for the Digital Filter
(red), the Spline (blue) and the Sliding Window (green). For the Spline
and the Digital Filter the "peaks" in this distribution are clearly anticorrelated to
the fingers in the time
distribution.
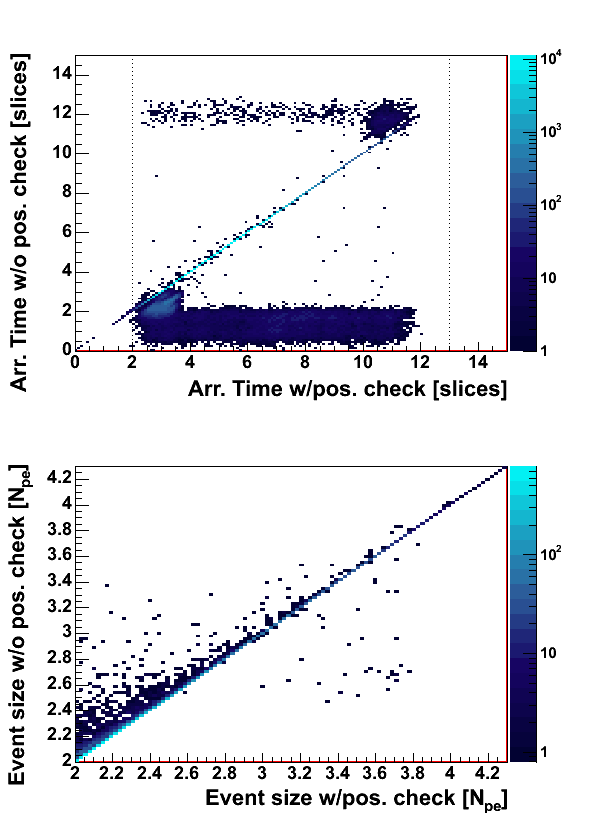
- The reason for this behavior can be seen from the scatter plot
of the N(pe) per inner
pixel vs. the arrival time, shown here for all three
extractors. The two upper plots show the distributions for Digital
Filter and Spline, respectively. At the edge of a time slice
(i.e., the "dips"), there are not only less events than in the middle
(at the "bumps"), but also clearly low charge events missing. This
correlates the "dips" in the scatter plot with
the "bumps" in the profile
plot, i.e., with the higher average reconstructed charge. On the
other hand we see in the arrival time distribution, that the "peaks" are
located at the edges of a slice. This merely shows that events with
small charges are more likely reconstructed in the middle of a slice
than on the edge.
- For the sliding window there is no obvios correlation to
the time distribution.
- There is an overall correlation of the average reconstructed
charge of all extractors with the arrival time, giving smaller sizes
for the early and late times. This may be partially due to the
inefficiencies of the extractors to reconstruct early/late pulses, but
may as well be partially generated by physics (shower development).
->
Back to top
-> Back to Other Signal Extractors
Camera
plots for 2005/06/01 using Spline (left: with pulse position check,
right: without pulse position check)
Camera plots for
2005/06/01 using Sliding Window (left: with pulse position check, right:
without pulse position check)
Camera plots for
2005/05/07 using Sliding Window (left) and Spline (right) without pulse
position check
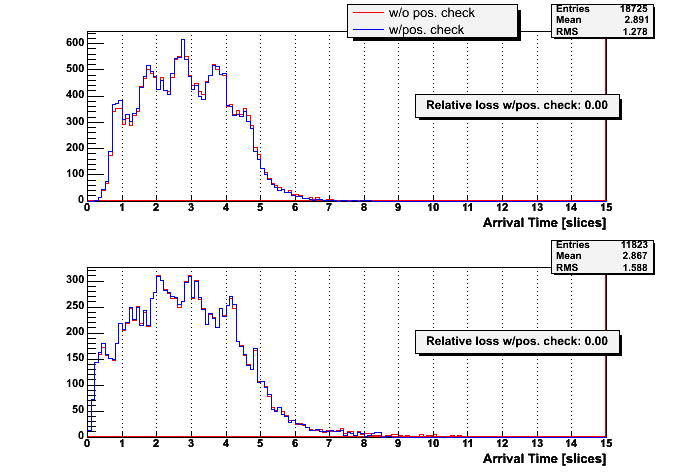
The
average arrival time per event on 2005/06/01 using Spline (top:
inner, bottom outer camera)
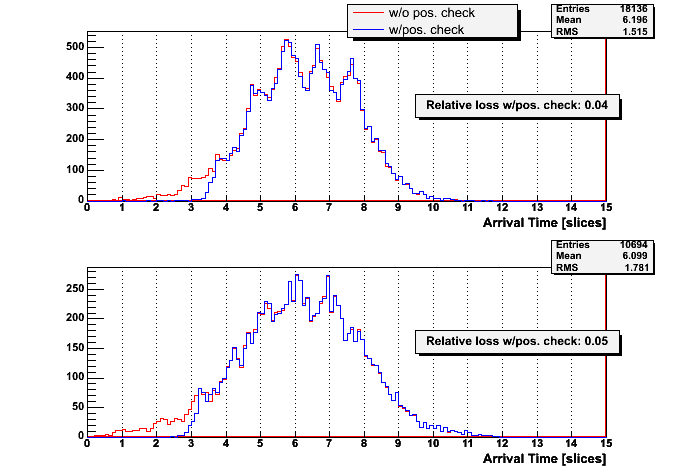
The
average arrival time per event on 2005/06/01 using Sliding Window
(top: inner, bottom outer camera)
The Average
Reconstructed Charge per Pixel as a Function of the Arrival Time for
Three Extractors
The Reconstructed
Charge per Pixel as a Function of the Arrival Time for Three Extractors
->
Back to top
->
Back to top
Size Dependence of Inhomeneities
The influence of a lower event size cut has been investigated. (Note
that the event size used here is not the same as the one used in the
hillas files, as there is no image cleaning applied). Below the camera
plots are shown for 2005/06/01, using a size cut of
- 250 N(pe)
- 500 N(pe)
- 1000 N(pe)
- 4000 N(pe)
The camera images seem to be a little bit smoother for size cuts above
500, however, the nonunoformity rermains to some degree. Between size
cuts of 500 and 2000 the picture does not change much, at size >
4000 the nonuniformity gets stronger, though.
The l
ogarithm of the
average event size is shown below against the average arrival time of
the event. Also there, a strong dependence of the average event
size on the arrival time can be seen, especially at the early arrival
times. The rise at late times might as well be due to physics reasons.
This needs to be checked further.
->
Back to top
-> Back to Size Dependence
Camera plots for
2005/06/01 with size>250 (left) and size>500 (right) pe without
pulse position check
Camera plots for
2005/06/01 with size>1000 (left) and size>4000 (right) pe without
pulse position check
Average of event size
(above 100) vs. the average arrival time of the event (night of
2005/06/01)
->
Back to top
->
Back to top
Conclusions
The inhomogeneity of the MAGIC camera with respect to the event and
charge distributions seems to be generated by the
spatial distribution
of the arrival times in the camera. This in turn is caused by the
setup of the trigger delays for the different macro cells. The
arrival time distribution generates arrival time differences
between events of up to 2 slices, depending on the position in the
camera where the trigger was generated. Therefore, even with
moderate mean arrival times (>4 FADC slices), the arrival time RMS
is relatively large. This means that always some part of the events has
very early (resp. late) arrival times and is not being reconstructed
correctly, i.e, the events are lost or reconstructed with a too
small charge.
This effect is even stronger, if the
mean arrival times are
in general very early (late), as it happened for instance very
often in May.
The effect is usually enhanced by the software (callisto) if the
default pulse position check is switched on. It should be clear that
shifting the lower edge of the signal extraction window 2 slices up
(typical for the pulse position check) is basically the same as
shifting the mean of the arrival time 2 slices down.
What should be on the "To Do List" is the following:
- Fix the trigger delays to even out the arrival time differences
in the camera
- For the time being:
- Other featurre seen during this study should be clarified as well:
->
Back to top
patty@mppmu.mpg.de
